How flight delays spread
Following 39.8 million US flights plane by plane, to see how far one late departure’s delay travels.
- Type
- Data analysis
- Year
- 2026
- Built
- 26 October 2026
- My part
- The question, the measures (such as the delay multiplier), checking the results, and the write-up
- Built with
- Claude Code (AI coding assistant)
- Tools
- SQL (DuckDB), Parquet, Python for downloads only
- Data
- US Bureau of Transportation Statistics on-time data, 2019 and 2022 to August 2026
- Size
- 39.8 million flights, 18 airlines, 388 airports
The question
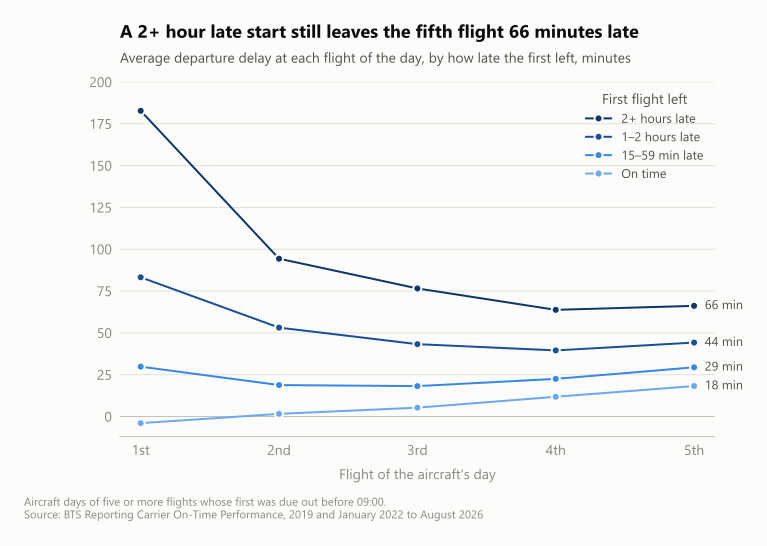
The biggest cause of flight delay the airlines report isn’t weather or their own problems. It’s a late incoming aircraft: 39.5% of all delay minutes. So when one flight leaves late, how far does that delay travel, down the rest of the plane’s day and across the airports it touches?
How I built it
Every month of flights arrives as a 270 MB file. I convert each to compressed Parquet, which shrinks 18 GB of CSV to 1 GB that DuckDB reads in place. A full rebuild, with every data check, takes 38 seconds on a laptop.
The thread through the data is the tail number, the registration painted on each plane. Sorting one tail number’s flights by when they actually left gives that aircraft’s day, and window functions compare each flight with the one before: how late the plane landed, how long the schedule gave it on the ground, and how late it left again.
The data needed cleaning first. Times are local with no time zone, so I work out which day each flight lands (Guam to Honolulu lands the day before it left). Allegiant drops the N from its tail numbers and Frontier writes them in lowercase. Each fix has a check, and the build fails if one does.
What I found
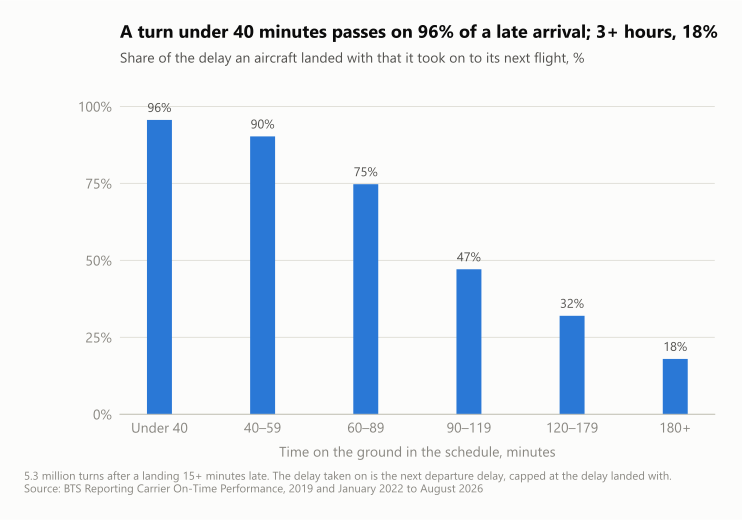
- Time on the ground decides how much delay is passed on. A turn scheduled under 40 minutes passes on 96% of a late arrival to the next flight; three hours or more passes on 18%.
- The airline matters more than the airport. I measured a delay multiplier for each airline: all its delay divided by the delay that didn’t come from a late aircraft. At Southwest it’s 2.02, so every fresh minute of delay grew into two. Delta’s is 1.41.
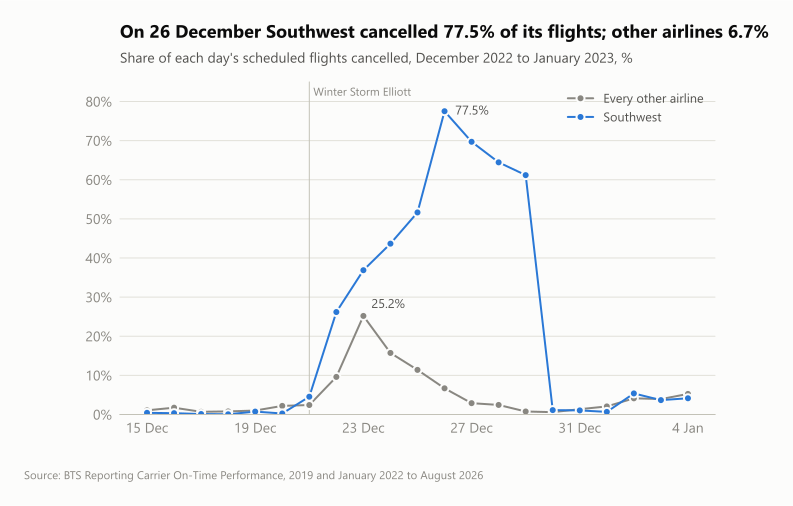
- A meltdown is a different kind of failure. In the Christmas 2022 storm, other airlines recovered in days while Southwest cancelled up to 77.5% of its flights. The same query finds Delta’s 2024 CrowdStrike outage without being told about it.
What to be careful about
The delay causes are the airlines’ own coding. The comparisons describe; they don’t prove cause, since airlines with short turns also differ in network and fleet.
What I’d do next
Put a price on slack: what would ten more minutes on the shortest turns save in delay, and cost in aircraft time?