Europe’s energy shock
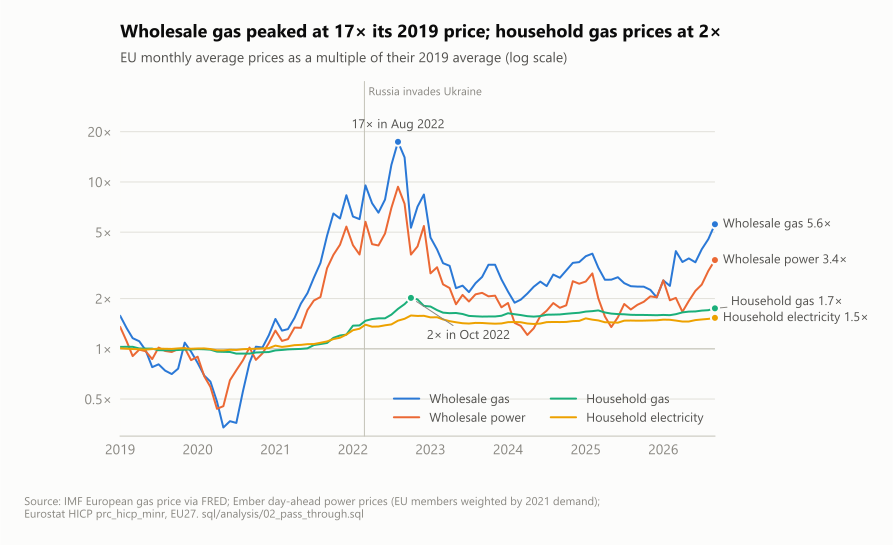
When Russian gas stopped flowing to Europe in 2022, how hard did it hit household bills, and why were some countries hit far worse than others?
- Type
- Data analysis
- Year
- 2026
- Built
- 26 October 2026
- My part
- The question, which sources to trust, checking the findings against the news, and the write-up
- Built with
- Claude Code (AI coding assistant)
- Tools
- SQL (DuckDB), Python for downloads only
- Data
- Nine public datasets: Eurostat, Ember, FRED, UN Comtrade
The question
The 2022 gas crisis was Europe’s biggest energy shock in decades. I wanted to follow it down the chain, from Russian supply to wholesale gas and power prices to what households paid, and find which link hurt households most. A second part follows the oil: once the EU stopped buying Russian crude, where did it go?
How I built it
Nine free datasets go into one DuckDB database. Python only downloads files and runs the SQL, which works in layers: raw files, then one cleaned table per source, then one query file per question. Every build runs data checks and fails if the keys between tables don’t match.
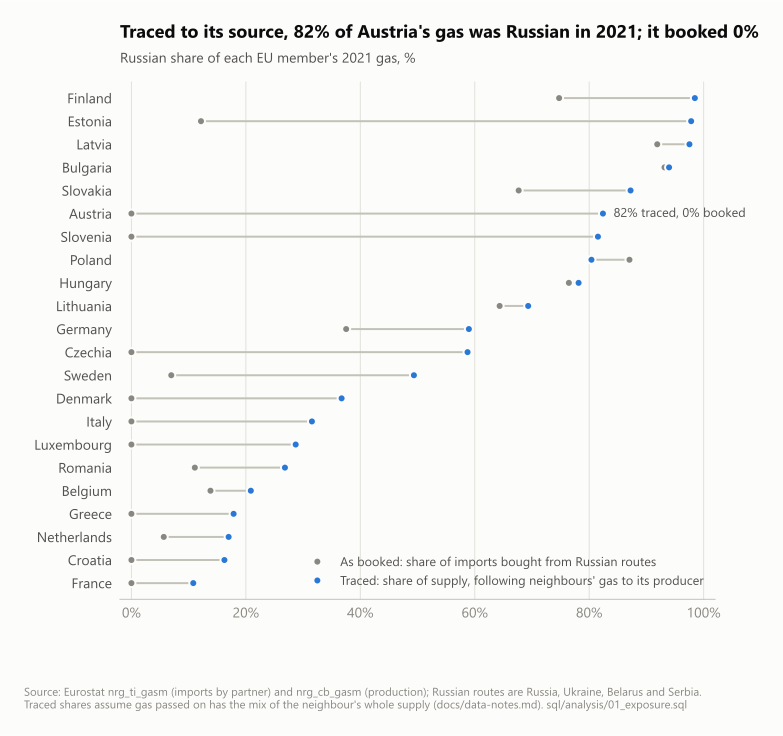
The hard part was making the sources agree. They spell countries differently (Greece is EL in Eurostat, GRC in Ember and 300 in Comtrade) and use different units: terajoules, terawatt-hours, dollars per million BTU, euros per megawatt-hour, tonnes. The biggest problem was that Eurostat records gas by the country it arrived from, not where it was produced. Austria bought its gas from Germany and Slovakia, so on paper it imported no Russian gas at all. I wrote a recursive SQL query that follows gas bought from EU neighbours back to the country that produced it.
What I found
- Households felt a fraction of the wholesale shock. Fixed-price contracts and government caps held most of it back, for a while.
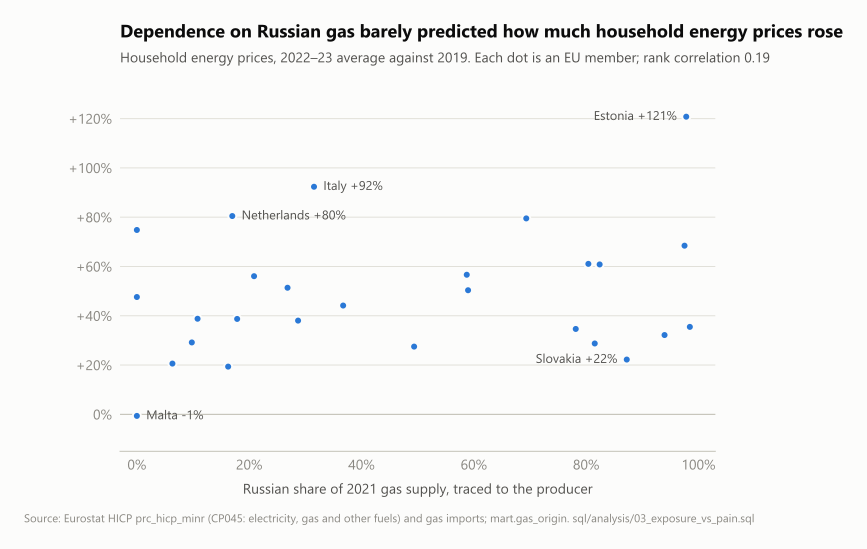
- Where you lived mattered more than where your gas came from. The rank correlation between a country’s dependence on Russian gas and its rise in household energy prices is only 0.19. Slovakia got 87% of its gas from Russia and saw prices rise 22%; Estonia, even more dependent, saw 121%.
- Russian crude was rerouted, not cut. The EU’s share of Russia’s crude exports to the four big buyers fell from 56% to 4% between 2021 and 2025, while India’s rose from 2% to 41%. The total barely changed.
What to be careful about
Prices are monthly averages, so daily spikes were higher. A correlation across 27 countries is weak evidence: it says dependence wasn’t the main driver, not what was. And the traced shares assume gas passing through a country has the same mix as everything it bought.
What I’d do next
Join my Red Sea shipping data to test whether the 2026 closure of the Strait of Hormuz explains the second price jump that started this year.