Aid to Ukraine
Who has paid to support Ukraine since 2022, how much of what was pledged has been allocated, and where the grain from the Black Sea corridor went.
- Type
- Data analysis
- Year
- 2026
- Built
- 26 October 2026
- My part
- The questions, deciding how to compare donors fairly, checking totals against the published ones, and the write-up
- Built with
- Claude Code (AI coding assistant)
- Tools
- SQL (DuckDB), Python for downloads only
- Data
- Six open datasets: Kiel Institute aid tracker, UCDP conflict events, NASA fire detections, UN grain corridor records, World Bank
The question
Aid totals in the news are usually pledges, and a pledge can sit a long way from delivery. Ranking donors by euros also hides how much a small country gives for its size. I wanted to know who has actually paid, how much of each pledge has been allocated, and where the grain shipped through the Black Sea corridor went.
How I built it
The hard part was making six sources agree:
- Countries are named five ways. One file says “Turkiye”, another uses codes that look standard but aren’t, and the World Bank’s
EUis a region, not the EU institutions that give aid. One country table holds every spelling each source uses, and the build fails if a name doesn’t match. - The aid spreadsheet is nested. Packages hold pledges, and pledges are allocated over many rows, so adding up the obvious column counts some aid twice. I worked out which rows carry each amount, and the build checks every donor against the Kiel Institute’s own published totals. All are within 1%.
- Places. Conflict events and satellite fire detections are placed into Ukraine’s regions by which boundary each point falls inside.
What I found
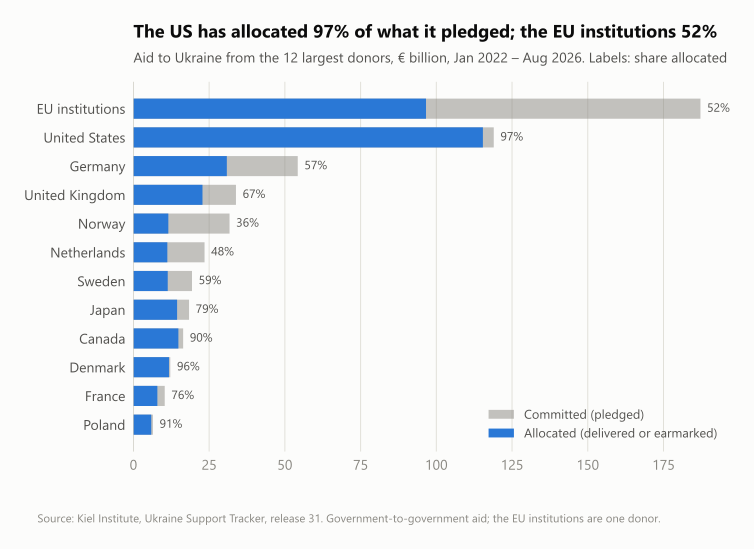
- The US allocated almost everything it pledged; Europe’s pledges are still running ahead. Of €573 billion committed, €383 billion has been allocated. The US has allocated 97% of its pledges, the EU institutions 52%, and almost half of the EU institutions’ commitments is one loan adopted in April 2026.
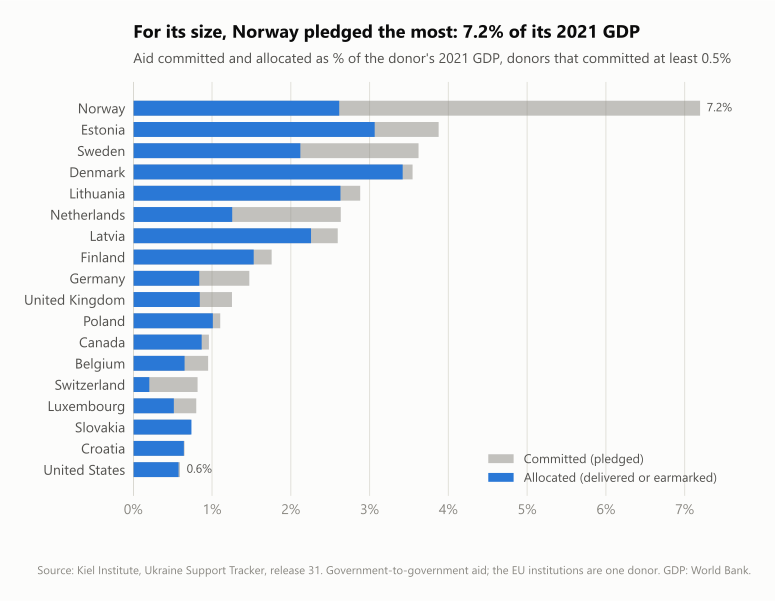
- For their size, Nordic and Baltic countries gave the most. Norway committed 7.2% of its 2021 GDP; the US 0.6%.
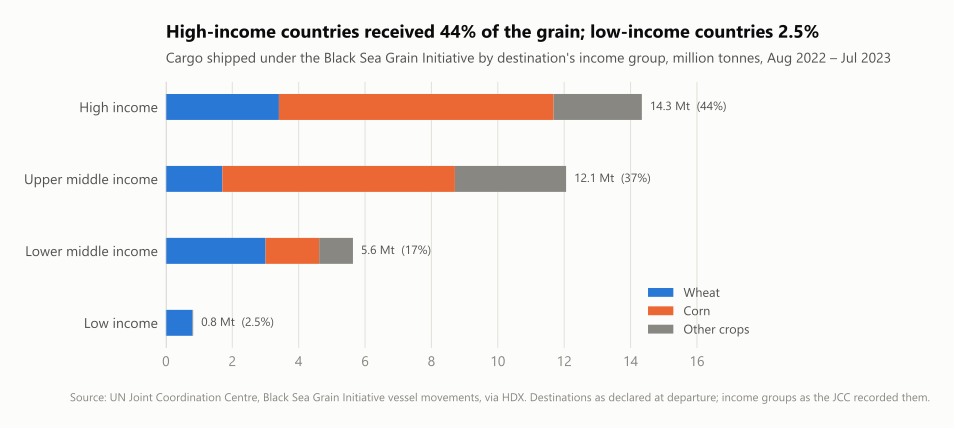
- Most of the corridor’s grain went to richer countries. High-income countries received 44% of 32.9 million tonnes; low-income countries 2.5%. Wheat went to poorer countries more than corn did.
- Satellites and conflict reports agree on where the fighting was, but not on when. The same five frontline regions lead both, but month by month they barely line up.
What to be careful about
Allocated is not delivered: the Kiel Institute counts aid once it’s earmarked or scheduled. A fire detection is a hot satellite pixel, not a confirmed fire. Grain destinations are as declared when the ship left.
What I’d do next
Split the EU’s own aid back to its member states, and test whether fires follow conflict events by a month or two.